
Data & Access
Reach BIEN data the way that fits your work
Explore interactively, script in R, or move through a service-specific workflow. The main entry points are the BIEN Data Portal, the BIEN R package, the Species and Traits ShinyApps, and the four services that clean and integrate every record.
Entry points
Ways to access BIEN
Browse BIEN data interactively and review products before downloading or querying.
Use BIEN from reproducible scripts, notebooks, and analysis pipelines.
Explore species occurrence summaries and BIEN-backed visualizations.
Review trait-focused summaries and exploration workflows.
BIEN 4.2 in numbers
plant occurrence records
vegetation plots
trait observations (54 standardized traits)
species with BIEN range maps
Enquist et al. 2026 describe BIEN 4.2 as an open, reproducible biodiversity informatics ecosystem. BIEN provides 98,829 curated species range maps plus 289,743 species in the associated open-access range database (Table 3). Records are standardized through TNRS, GNRS, GVS, and NSR; only about half of original records pass strict combined taxonomic and geographic validation, so BIEN attaches quality-control flags for transparent filtering. Counts are version-dependent and change between releases.
A near-complete inventory of land plants
After taxonomic standardization through the TNRS, the cumulative number of land-plant species recorded over time is approaching an asymptote — evidence that the global catalogue of land-plant species is nearing saturation, and that BIEN’s harmonized integration of GBIF and non-GBIF sources adds species beyond any single source.

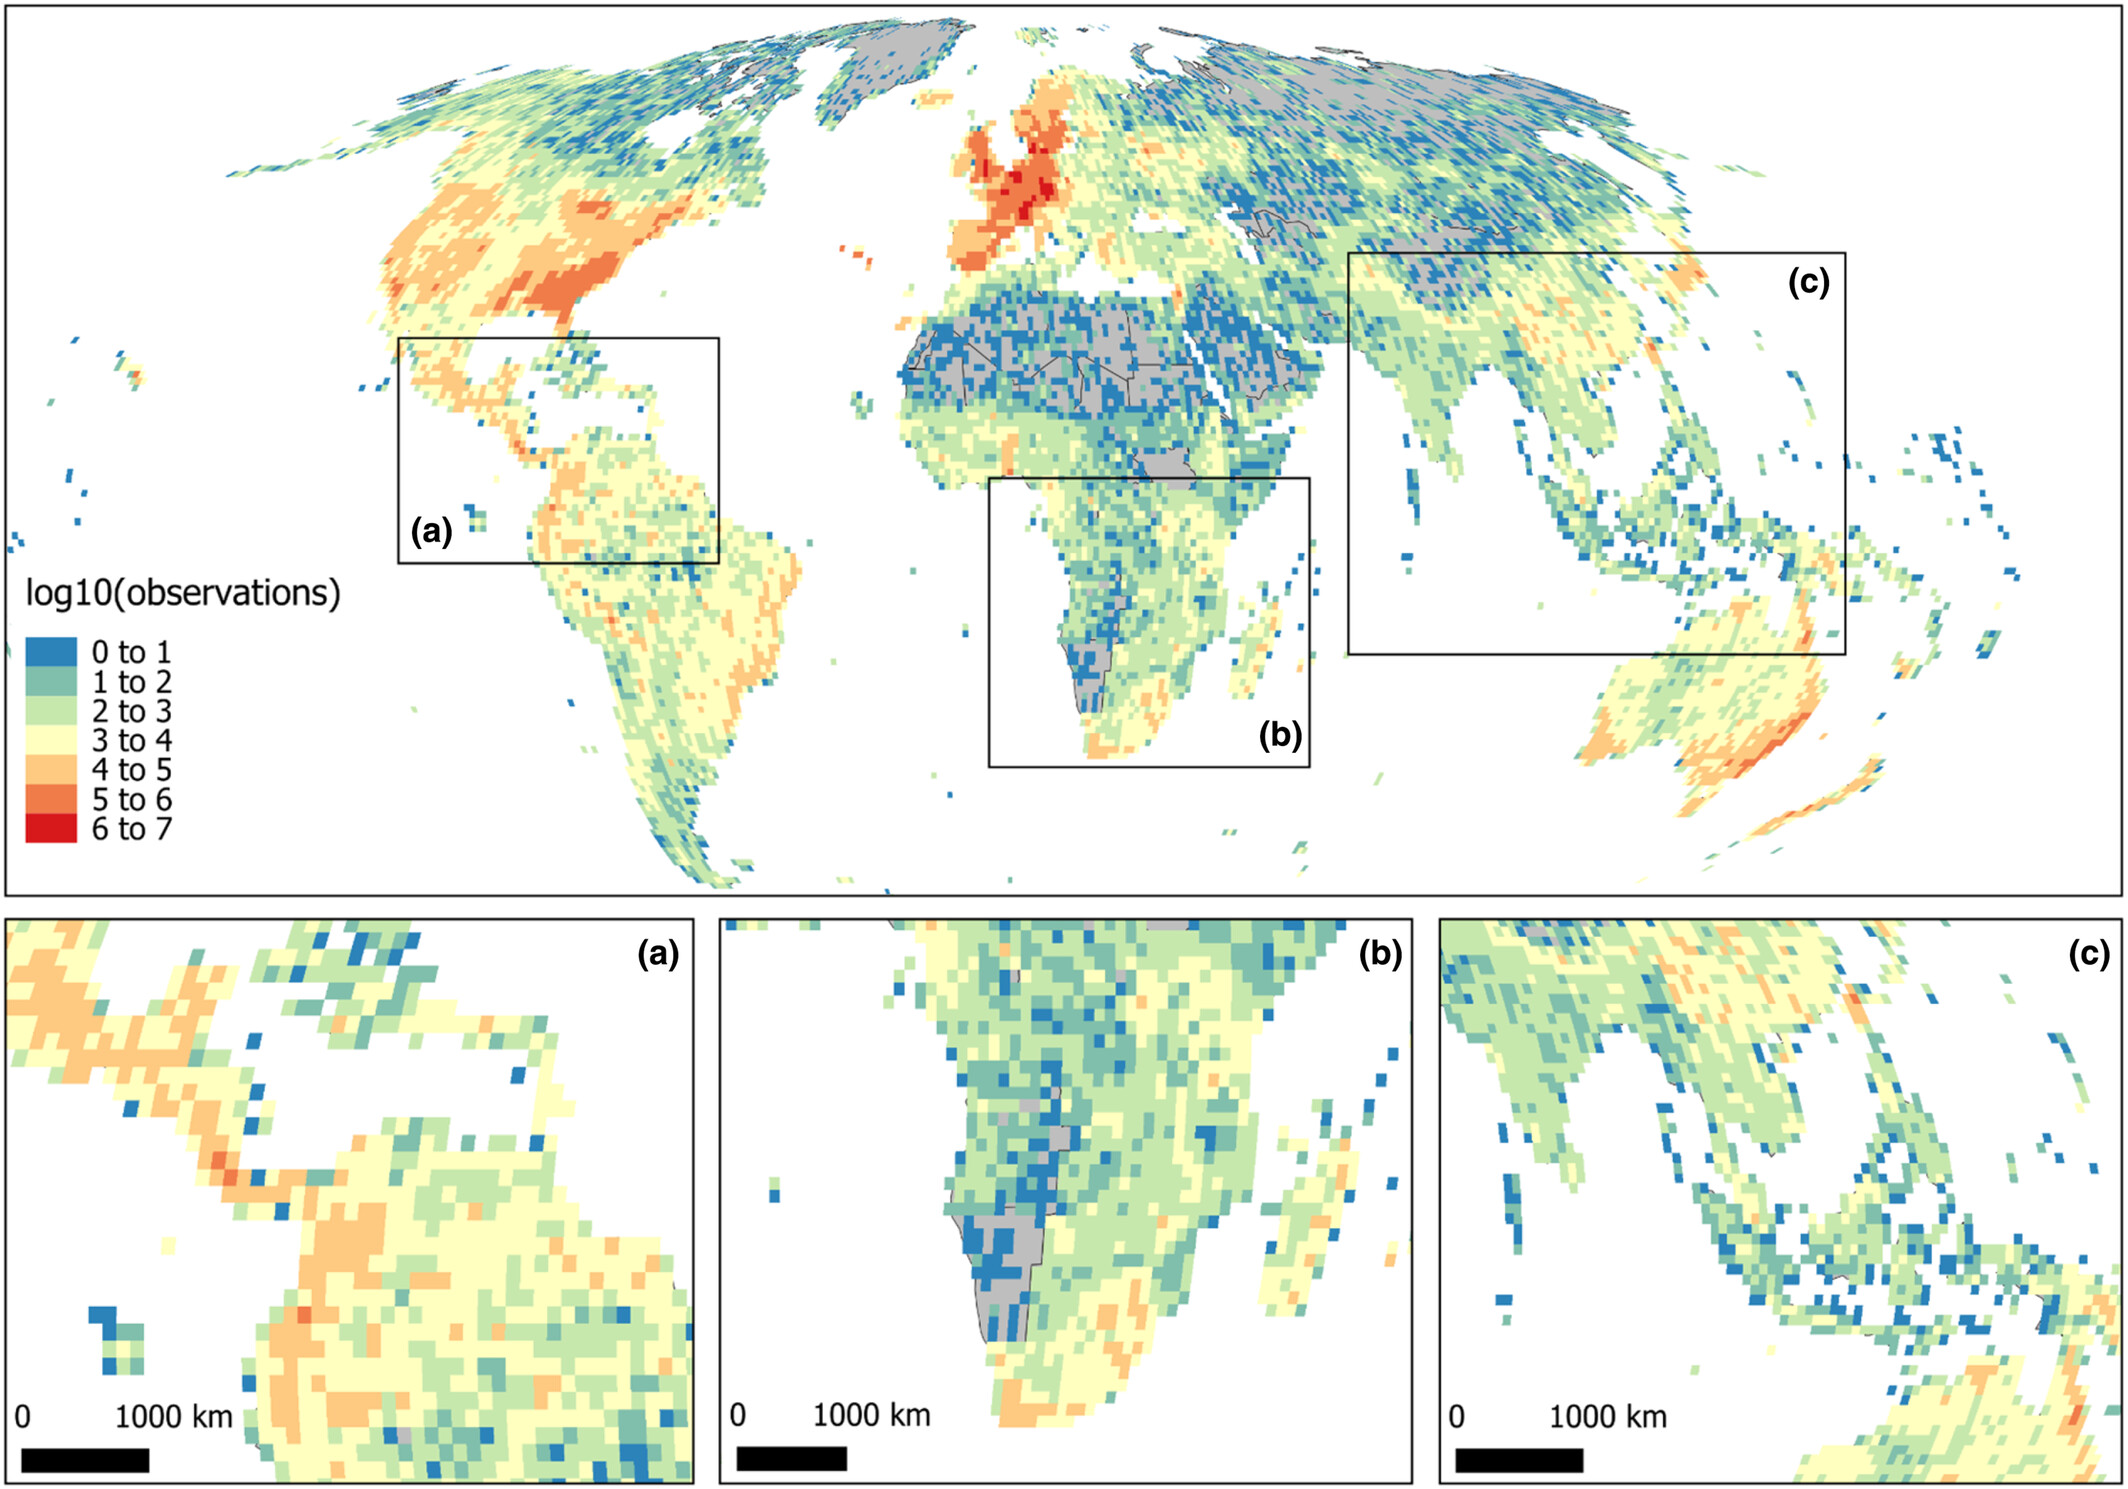
Where the data come from — and where they are sparse
Sampling intensity is uneven. Coverage is strongest in North America and parts of the Global North, and sparser in biodiversity-rich but underrepresented regions of the Global South. Reading data with this in mind is essential for unbiased inference.
Read the data responsibly
Record the database version and access date with any analysis or citation.
Results depend on scope, filters, and validation settings.
Occurrence, trait, and range products are not interchangeable.
Use-case caveat. Range products indicate modeled potential distribution, not direct proof of occupancy at all locations. See Methods and Workflow for the validation logic.
Primary citation: Enquist BJ, Boyle B, Maitner BS, et al. (2026). BIEN: A biodiversity informatics ecosystem advancing open and reproducible workflows for plant observation, plot and trait data. Methods in Ecology and Evolution, 17(5), 1556–1584. DOI: 10.1111/2041-210X.70274.