
Overview
One standardized, analysis-ready home for plant biodiversity data
The Botanical Information and Ecology Network (BIEN) integrates hundreds of millions of plant observations — herbarium and museum specimens, citizen-science records, vegetation plots, and functional traits — into a single, quality-controlled, reproducible resource. Every record carries provenance and validation flags, so you can filter transparently and reproduce exactly what you did.

BIEN 4.2 in numbers
plant occurrence records
vegetation plots
trait observations (54 standardized traits)
species with BIEN range maps
Counts reflect the BIEN 4.2 release (Enquist et al. 2026, Table 3). BIEN provides 98,829 curated species range maps, plus 289,743 species in the associated open-access range database. Figures are version-dependent and change between releases.
What BIEN is
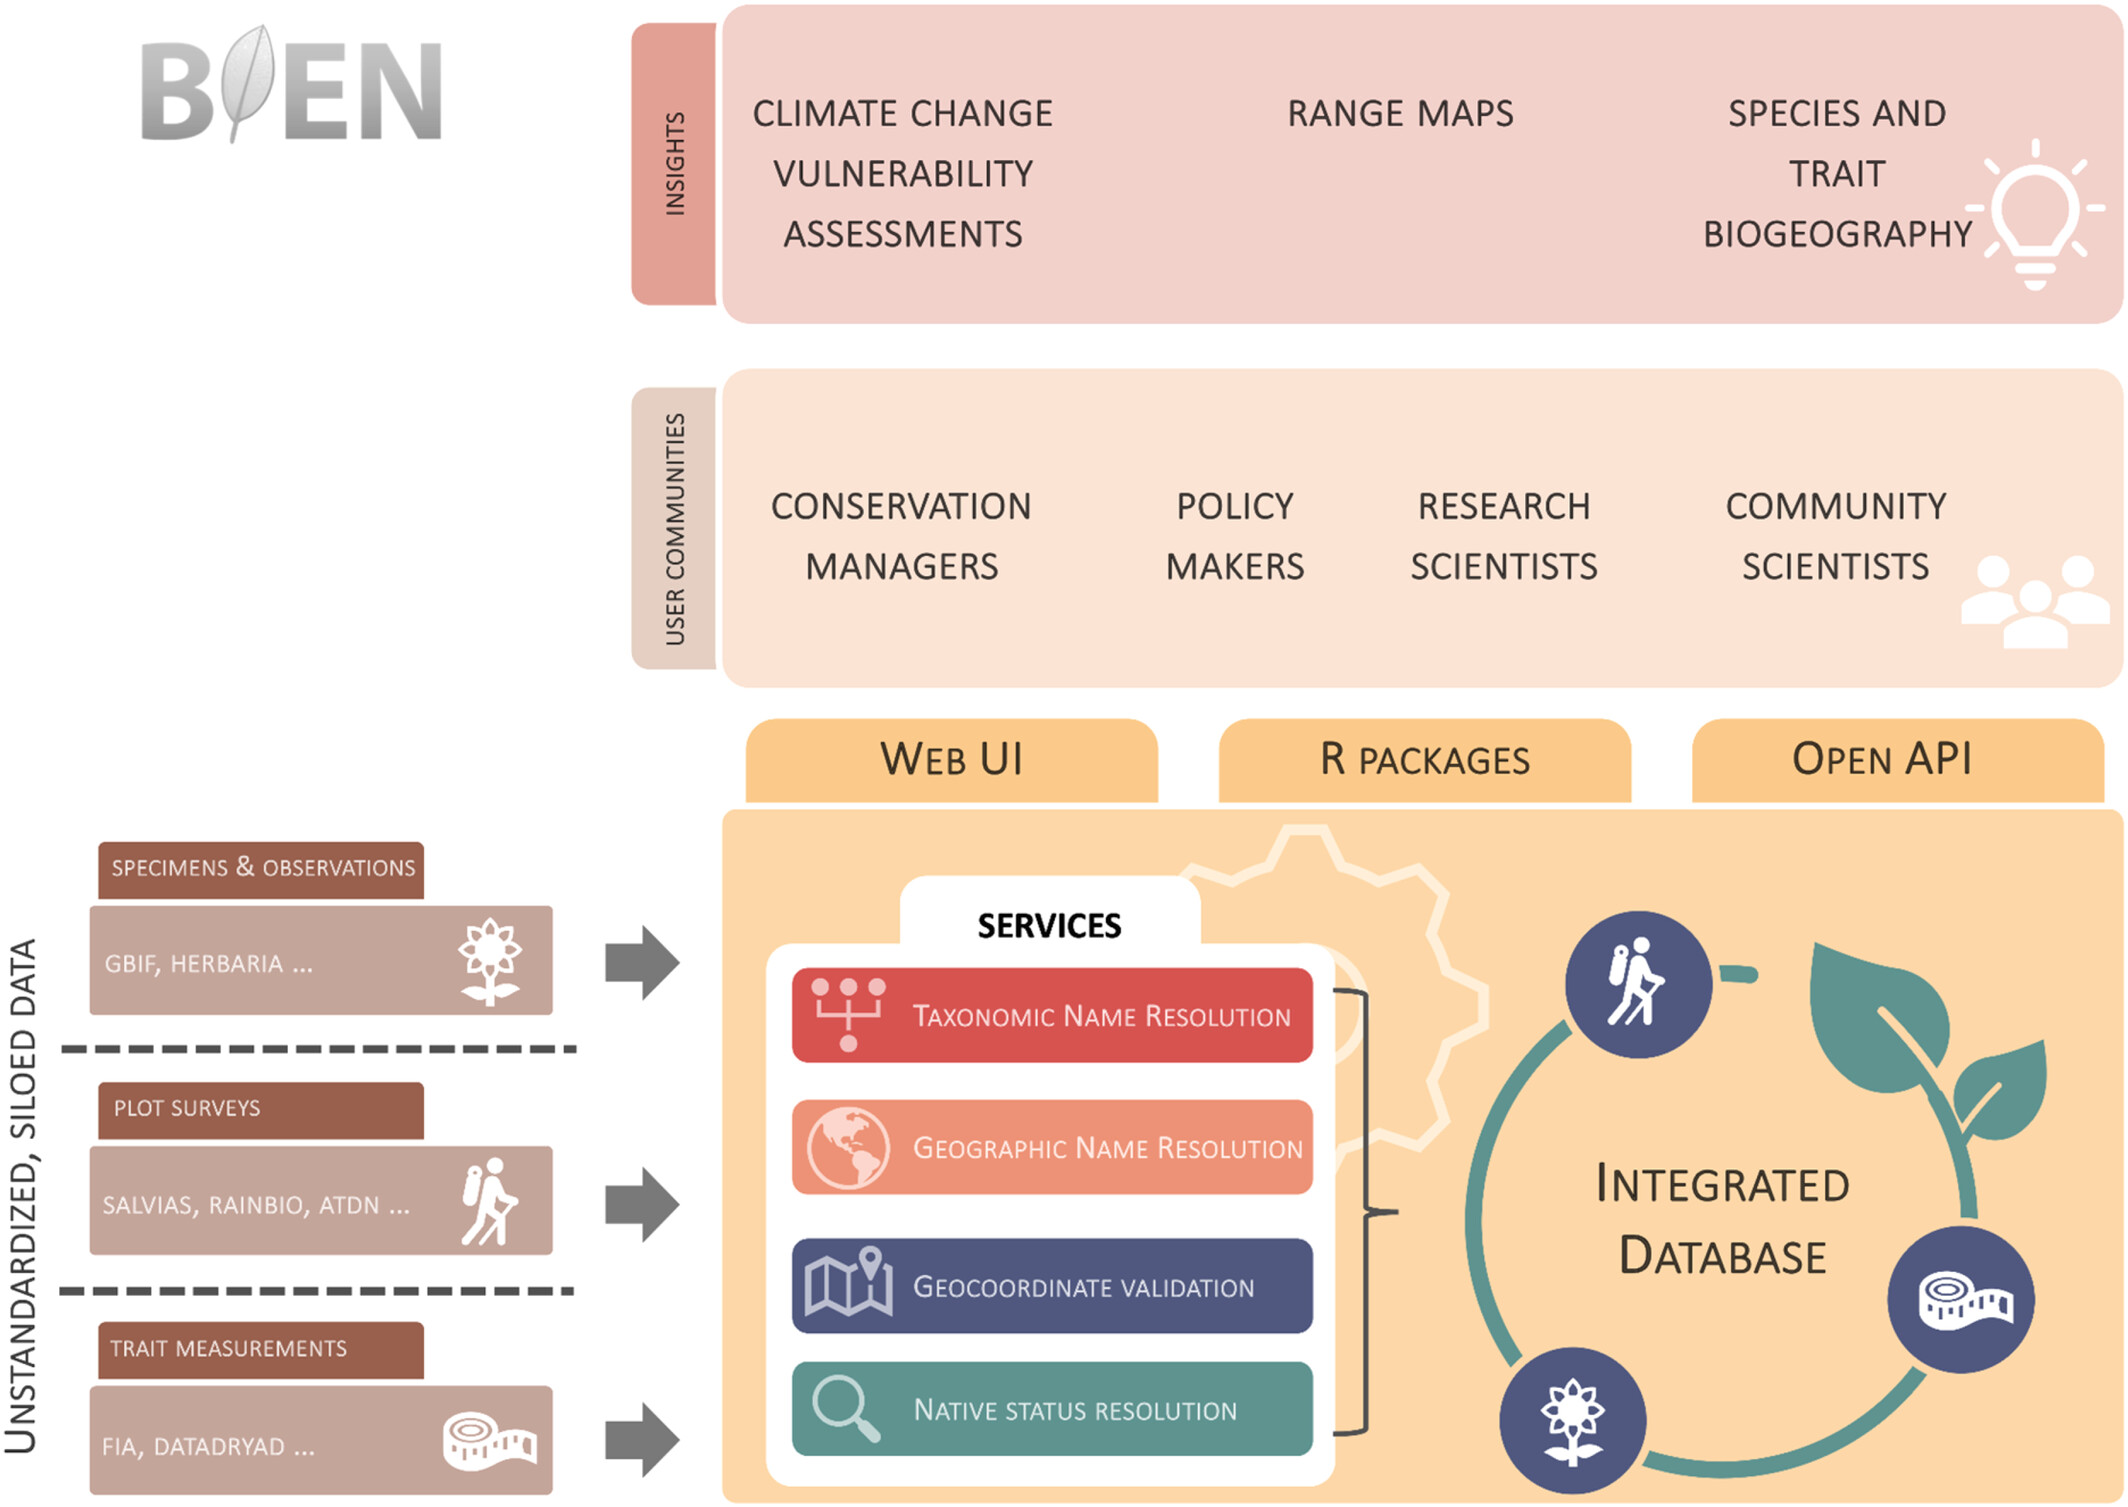
BIEN is a data ecosystem, not just a database. Unstandardized, siloed observations are imported, cleaned, standardized, and integrated through openly available services — reachable through a web interface, R packages, or an API — and then housed in a single database. From that harmonized core BIEN produces end products such as species range maps and climate-change forecasts that diverse research communities use for biodiversity science.
Why standardization matters
Large biodiversity datasets rarely arrive ready for analysis. Species names carry synonyms and misspellings; coordinates fall in oceans or on political centroids; cultivated records are mixed with wild populations. In BIEN 4.2, only about half of original records pass strict combined taxonomic and geographic validation. Rather than hide those losses, BIEN attaches quality-control flags to every record so researchers filter data explicitly instead of relying on hidden assumptions.
Every record passes through four coordinated services, each adding flags you can use to subset the data:
Taxonomic Name Resolution
Geographic Name Resolution
Geocoordinate Validation
Native Species Resolver
What the harmonized data reveal
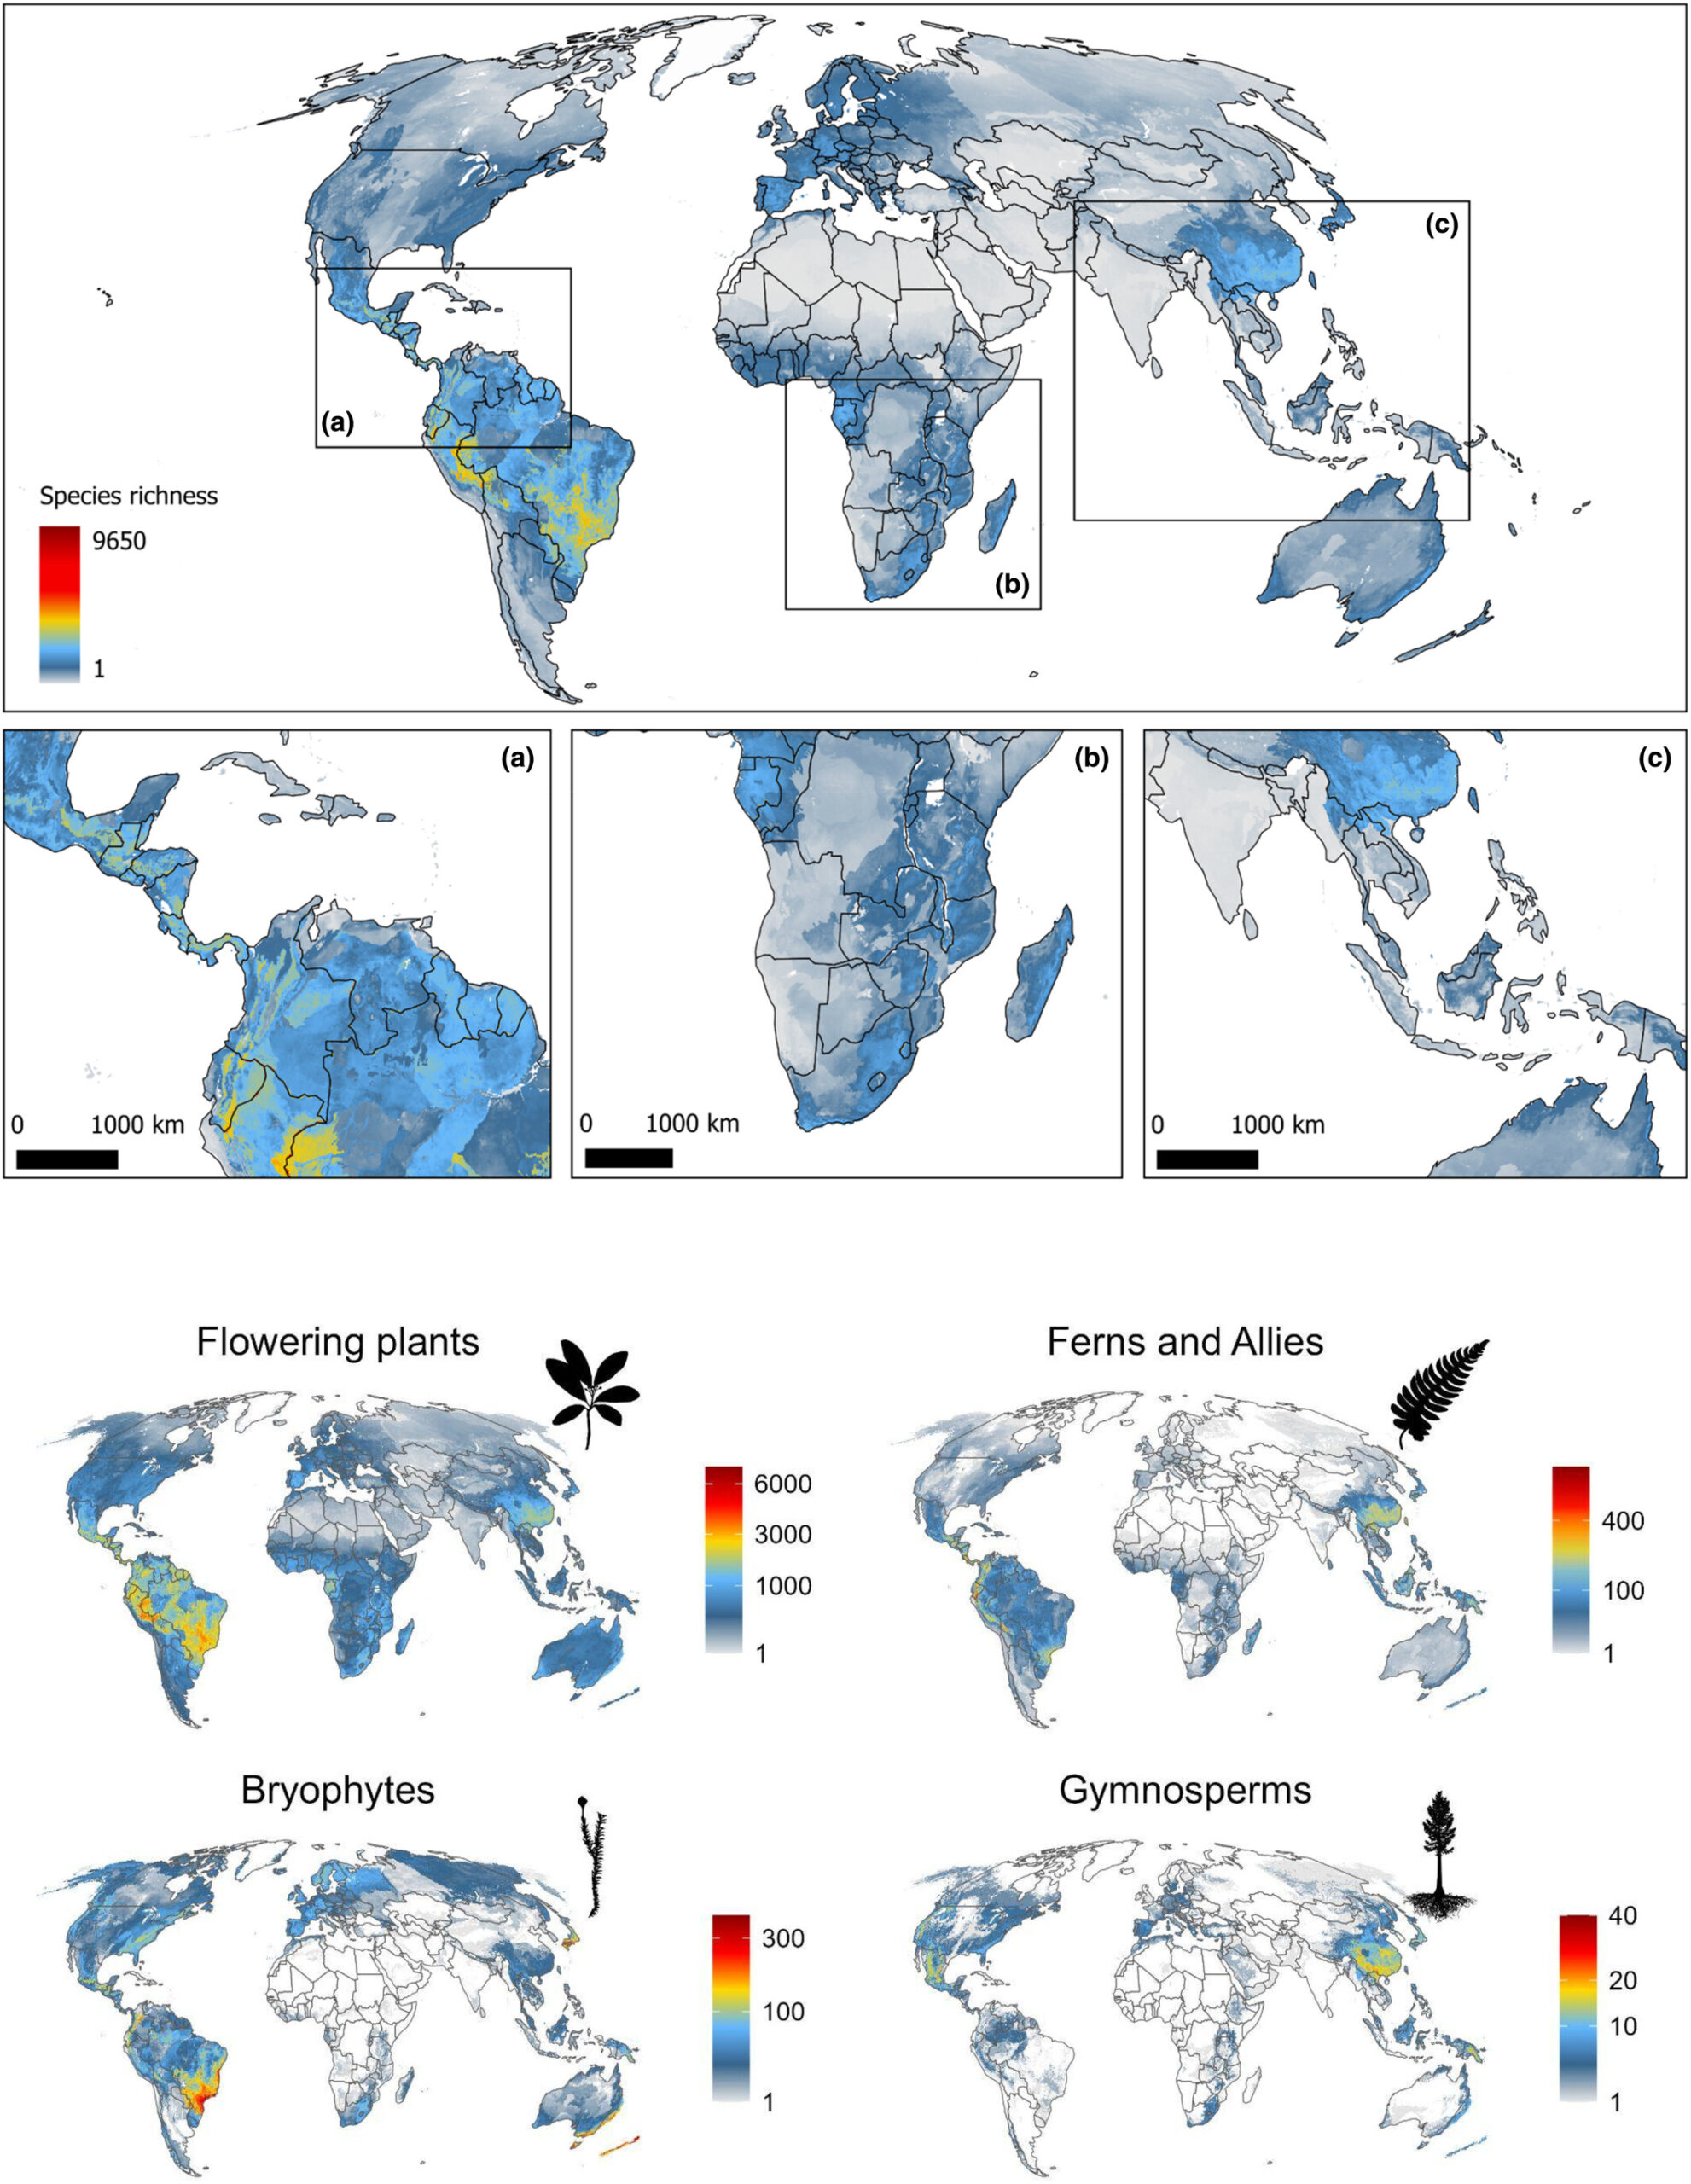
Because every range is built on the same standardized backbone, individual species maps can be stacked into continental and global pictures of plant diversity. The map below stacks 289,743 land-plant (Embryophyta) ranges to show where richness concentrates — and how the pattern differs among flowering plants, ferns and allies, bryophytes, and gymnosperms.
Move quickly from orientation to work
Data portal, the BIEN R package, and interactive applications.
The four validation services and the quality-control logic.
Shiny apps, TNRS/GNRS/GVS/NSR services, and validations.
How to cite BIEN and the studies built on it.
BIEN complements GBIF
GBIF mobilizes biodiversity records across all taxa. BIEN harmonizes, validates, and links plant records — adding taxonomic, geographic, native-status, and trait context — to support reproducible ecological and evolutionary inference. The two are complementary layers of the open biodiversity-data landscape.
Scientific caveat. Coverage is strongest for New World vascular plants, and sampling effort is spatially and taxonomically uneven. Modeled range maps are statistical predictions, not verified occupancy. Analyses should report filters, provenance, and uncertainty explicitly.
Citation: Enquist BJ, Boyle B, Maitner BS, et al. (2026). BIEN: A biodiversity informatics ecosystem advancing open and reproducible workflows for plant observation, plot and trait data. Methods in Ecology and Evolution, 17(5), 1556–1584. DOI: 10.1111/2041-210X.70274.